


In the below article, we will be generating Voronoi diagrams from scratch with the help of the Python programming language in both the 2D and 3D planes which keeps changing randomly when you run your code.
Introduction
Before we go on to write Python code to generate Voronoi diagrams, let's discuss what exactly is and the significance Voronoi diagrams have in the realm of computer science theory.
A Voronoi diagram is a type of pattern that is commonly used in computer graphics.
It is in general used in the fields involving geometry and in the real world it can solve a lot of problems like finding the shortest distance and so much more.
A Voronoi diagram is a pattern that has scattered points across a plane which are divided up into individual cells in a Euclidean plane where each cluster of the points is divided up based on how close they are to each other in terms of their Euclidean distance. The cells inside the Voronoi Diagrams are formed through the stark triangulation pattern known as the Delaunay Triangulation pattern which causes the triangulation pattern in Voronoi diagrams.
2D Voronoi Diagram Formation
Now, we will be writing Python code from scratch using only the matplotlib library to visualize the plots.
First, we will be importing the requirements,
import random
import matplotlib.pyplot as plt
The random library is used for randomizing the inputs provided to view different patterns of the Voronoi diagram and the matplotlib library is used for plotting it.
We will now be generating the closest points randomly and this point distance is calculated through the Euclidean Distance.
def euclidean_distance(p1, p2):
    return ((p1[0] - p2[0]) ** 2 + (p1[1] - p2[1]) ** 2) ** 0.5

def closest_point(sites, p):
    return min(sites, key=lambda x: euclidean_distance(x, p))

def generate_points(n, xmin, xmax, ymin, ymax):
    return [(random.uniform(xmin, xmax), random.uniform(ymin, ymax)) for _ in range(n)]
The minimum distance is calculated as we need the closest points and all of these are stored in a 1D array of tuples.
def voronoi_diagram(sites, xmin, xmax, ymin, ymax):
    diagram = {}
    for y in range(ymin, ymax):
        for x in range(xmin, xmax):
            closest = closest_point(sites, (x, y))
            if closest in diagram:
                diagram[closest].append((x, y))
            else:
                diagram[closest] = [(x, y)]
    return diagram
After this, we generate the Voronoi diagram by iterating from the minimums to the maximums, and then we populate them to a dictionary where the keys are the points and the values of the keys are the list of points associated with the closest item in the diagram dictionary.
Finally, we call all of the above functions with the below code,
points = generate_points(10, 0, 100, 0, 100)
print(points)

diagram = voronoi_diagram(points, 0, 100, 0, 100)
print(diagram)

for point, region in diagram.items():
    x, y = zip(*region)
    plt.scatter(*point)
    plt.scatter(x, y)

plt.show()
The plt.show() and plt.scatter() functions are used from the matplotlib library and are used to plot the Voronoi diagram from the values of the dictionary which are a list of tuples.
An Example 2D plot of a Voronoi Diagram
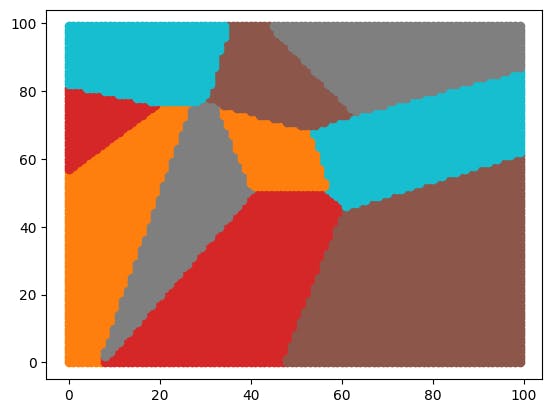
Overall, a plot similar to the above which is randomly generated on refresh is generated from the given source code.
3D Voronoi Diagram Formation
Now, we will take this a step further and we will be generating a 3D plot of a Voronoi diagram which is one of the most popular ways of representing them from scratch using the same tools of Python and the matplotlib library with the addition of the numpy library due to the ease of its usage for 3D point functions.
def generate_random_points(num_points, bounds):
    points = []
    for _ in range(num_points):
        point = [np.random.uniform(bounds[0][0], bounds[0][1]),
                 np.random.uniform(bounds[1][0], bounds[1][1]),
                 np.random.uniform(bounds[2][0], bounds[2][1])]
        points.append(point)
    return np.array(points)
The above function is responsible for the generation of a set of 3D points in a random fashion. We first set up bounds within which the points are to be generated randomly and using that we randomly generate the points required.
def calculate_distance(p1, p2):
    return np.sqrt((p2[0] - p1[0])**2 + (p2[1] - p1[1])**2 + (p2[2] - p1[2])**2)

def find_closest_point(point, points):
    min_dist = float('inf')
    closest_point = None
    for p in points:
        dist = calculate_distance(point, p)
        if dist < min_dist:
            min_dist = dist
            closest_point = p
    return closest_point
We calculate the distance through an extension of the Euclidean distance in a 3D space and apply it to the tuple list we have. After this, we calculate the closest point using the standard algorithm to identify minimum values where we set a global maximum and update it as we go to finally find the closest point.
def generate_voronoi(points):
    voronoi_cells = {}
    for p in points:
        voronoi_cells[tuple(p)] = []
        for q in points:
            if tuple(p) != tuple(q):
                voronoi_cells[tuple(p)].append(find_closest_point(q, points))
    return voronoi_cells
We now populate a dictionary with the closest points where the key is the current tuple and its values are the lists of points that are closest to the currently used Tuple.
def plot_voronoi(voronoi_cells):
    fig = plt.figure()
    ax = fig.add_subplot(111, projection='3d')
    for cell in voronoi_cells:
        points = np.array(list(voronoi_cells[cell]) + [cell])
        xs = points[:, 0]
        ys = points[:, 1]
        zs = points[:, 2]
        ax.plot(xs, ys, zs)
    plt.show()
We now use the functions provided by the matplotlib library, plot the points that we have populated inside of the dictionary.
num_points = 20
bounds = [[0, 10], [0, 10], [0, 10]]

points = generate_random_points(num_points, bounds)
voronoi_cells = generate_voronoi(points)
plot_voronoi(voronoi_cells)
We finally call all of the functions as required, first set the bounds, randomly generate the points and apply Euclidean distance on them, populate the points based on their closeness to each other inside of a dictionary and finally plot them in a plane.
An Example 3D plot of a Voronoi Diagram

Applications
Voronoi diagrams are used in a multitude of fields and are not constrained and used only in the field of computer science.
Urban Planning : Voronoi diagrams can be used to identify freight loading space by determining the loading regions closest to each other.
Mining : Voronoi diagrams are used a lot in the mining space to estimate the overall mineral resources that are based on exploratory drill holes.
Network Analysis : In the case of complex networks, they can be used to narrow down the regions closest to each point of the network.
Aviation : In the aviation industry, Voronoi diagrams are used to identify the nearest airport in the case of path diversions.
Autonomous robot navigation : Voronoi diagrams can be used to find clear ways in autonomous robot navigation by identifying the edges of the graph that are furthest from obstacles
Conclusion
In this article, we have learned about Voronoi diagrams and their widespread usage combined with their applications in the field of computer science along with their implementation and visualization in both the 2D and 3D space.
Voronoi diagrams found in the 18th century are a pattern that had initially begun being observed in nature like in the patterns of the leaves and led to the widespread usage of this mathematical concept in a lot of sophisticated fields like AI and 3D computer graphics and has helped solve tons of complex problems that previously couldn't be visualized like the global scene reconstruction used in 3D generation models and more.
P.S. The algorithms used in this article to plot the Voronoi diagrams are not that efficient and much more efficient algorithms like the Lloyd's algorithm, the Fortune Algorithm, and more exist for the point generation and stuff required for the algorithm.